India (English)
Your Home's Air. Always in Your Pocket.
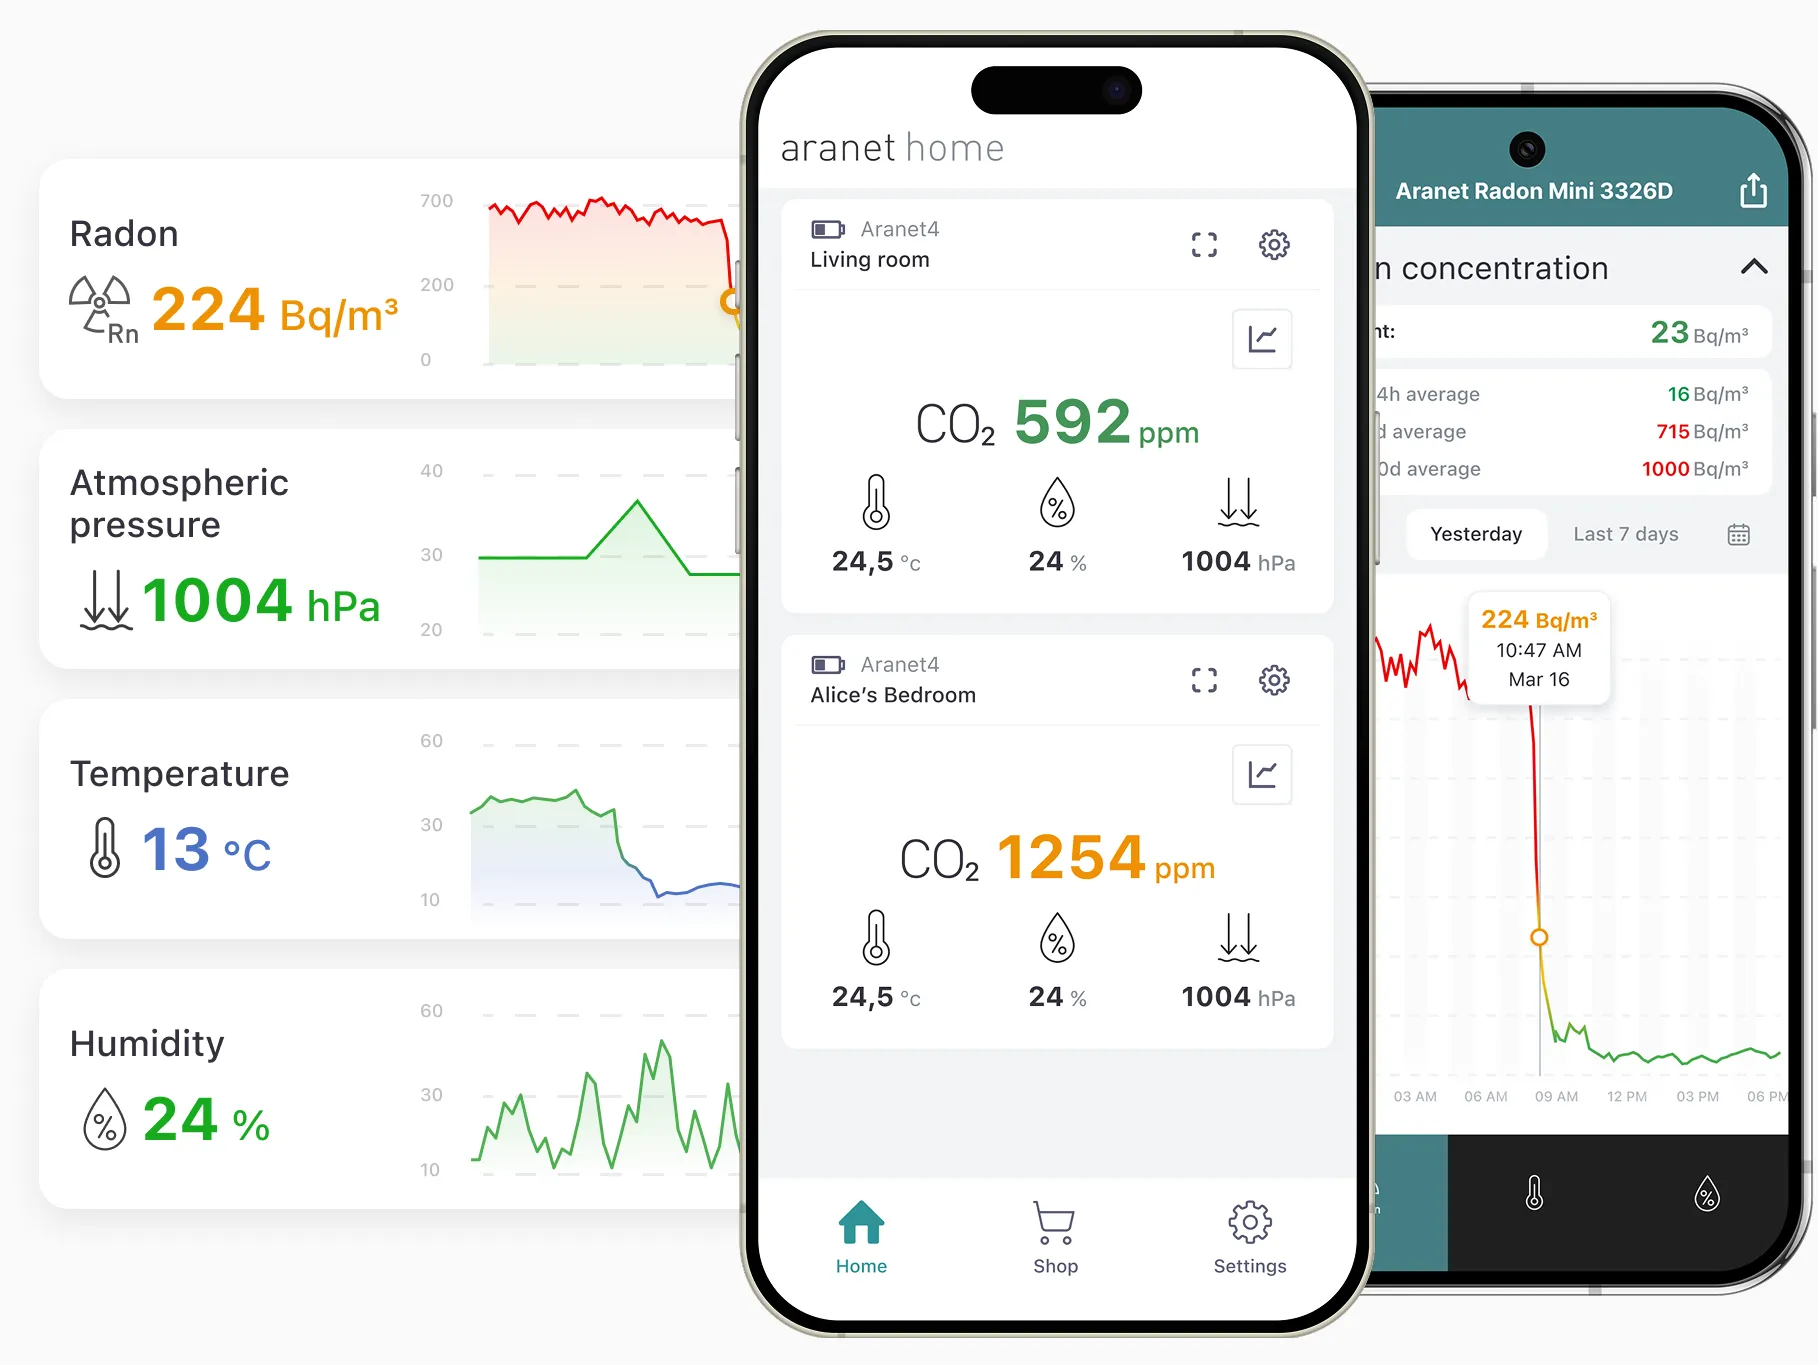
See CO2, radon, temperature, humidity, and radiation levels - in real time, from every room. Aranet Home turns your sensor data into clear, actionable readings.
Step 1. Pair via Bluetooth.
Step 2. Place it in any room.
Step 3. Start tracking.
See Everything Your Home Measures.
See Patterns, Not Just Readings.
Most air quality problems repeat. Aranet Home charts your history so you can find them.
- 90 days of history - daily, weekly, and long-term views
- Spot which room and which hour cause problems
- CO2, radon, radiation, humidity - all charted automatically
Every Room. One Screen.
Stop walking room to room. See all your sensors at once - from your phone.
- Aranet4, Aranet2, Radon Plus, Radon One, and Radiation sensors - all in one view
- Real-time readings without checking device displays
- Compare rooms side by side instantly
Measure as Often as You Need.
More frequent readings give you precision. Less frequent ones extend battery life.
- Choose 1, 2, 5, or 10-minute intervals
- Adjust per sensor, per room — inside the app
- Longer intervals can extend battery life by years
Five Parameters. One App.
Pair the sensors that matter to you — the app adapts to what you've connected.
- CO2, temperature, humidity, atmospheric pressure
- Ionizing radiation and radon for deeper monitoring
- Each sensor adds a new data stream automatically
Clear, readable charts
90 days of stored history
Bluetooth, no Wi-Fi needed